
Manipulation or Expected Behavior? Understanding False Breakouts Through Correlation
Introduction
One of the biggest misconceptions in trading is mistaking “false breakouts” for market manipulation. Traders often see price breaking above resistance or below support, only to reverse sharply, and assume that large institutions or algorithms are “hunting their stops.” But what if these breakouts are simply the result of market structure and the natural pull of correlated assets?
By analyzing correlated assets and their significant levels, traders can anticipate these “false breakouts” and recognize them not as traps, but as predictable behaviors. In this post, we’ll break down how using correlated markets—like the E-mini S&P 500 (ES) and the Nasdaq 100 (NQ)—along with predefined key levels can help traders avoid getting caught in these misleading moves.
Why Do False Breakouts Happen?
False breakouts occur when price breaches a key level—such as a previous high, low, or resistance—but fails to sustain momentum and reverses. There are a few key reasons why this happens:
Liquidity and Order Flow
- Breakouts attract breakout traders and stop orders from those fading the level.
- Smart money exploits this by pushing price beyond the level, filling liquidity, and reversing the move.
Magnet Effect of Correlated Assets
- A highly correlated asset might still be moving toward its own resistance or support.
- Once that asset reaches its key level, both instruments reverse in tandem.
Trigger Points and Market Structure
- Certain price levels act as magnets, where price is naturally drawn before reversing.
- E.G. Trigger Points provide predefined areas where reversals are more likely.
Instead of assuming manipulation, traders should ask: “Is the correlated asset still reaching for a level?” If so, the breakout we see might not be a genuine trend continuation—it’s simply one asset waiting for the other before making a directional move.
Using Correlated Assets to Filter False Breakouts
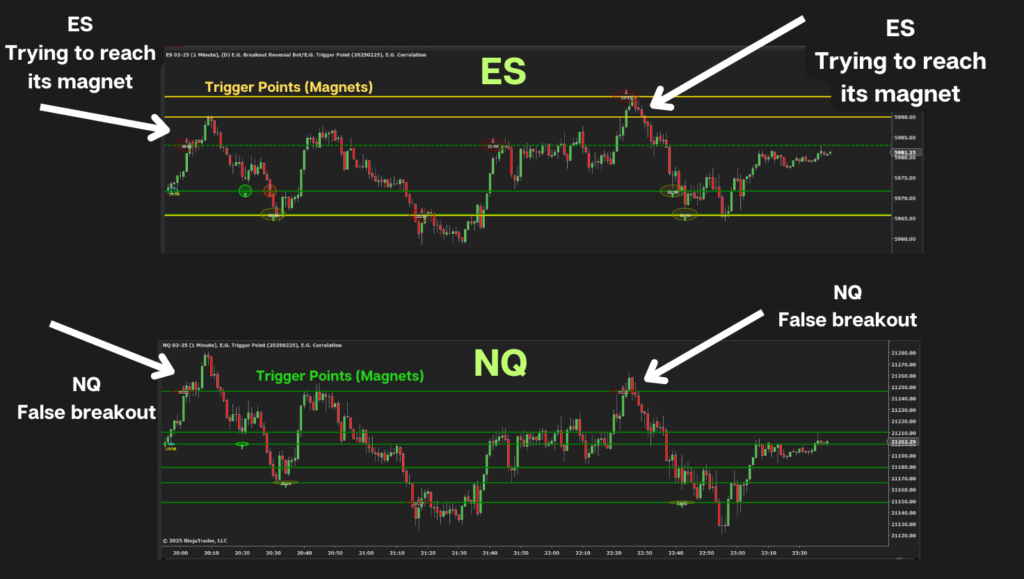
ES vs. NQ: A Classic Example
The E-mini S&P 500 (ES) and Nasdaq 100 (NQ) are highly correlated, meaning they often move in sync. However, they don’t always move with identical timing. This lag can create the illusion of a breakout in one market, while the other is simply catching up.
Example: Spotting a False Breakout
Let’s say you’re watching NQ as it approaches a key resistance level. Suddenly, NQ breaks above resistance, making it look like a valid breakout. But before you jump in, you check ES:
- ES is still moving toward its own resistance.
- This suggests that NQ’s breakout is not a true breakout, but rather a reaction to ES pulling it higher.
- Once ES reaches its resistance, it reverses.
- Because of the correlation, NQ follows suit and also reverses.
By waiting for confirmation from ES before trading NQ, traders can avoid buying into a breakout that’s about to fail.
Practical Trading Strategy
Step 1: Identify Trigger Points on Both Markets
- Use E.G. Trigger Points to mark significant price levels on ES and NQ.
- These levels act as magnets where price is likely to pause or reverse.
Step 2: Track the Correlation in Real-Time
- If one market breaks a level, check if the other is still approaching its key area.
- If the correlated market has not yet reached its resistance/support, wait.
Step 3: Enter Only After Both Markets Align
- If NQ breaks resistance but ES is still moving higher, hold off.
- When ES reaches its resistance and starts reversing, that’s your signal to fade the false breakout on NQ.
Conclusion
False breakouts are not always manipulations. Often, they are a result of correlated assets still moving toward their own levels. By using significant price levels like the E.G. Trigger Points and analyzing assets like ES and NQ together, traders can anticipate these moves rather than getting trapped in them.
Next time you see a breakout, look at the correlated market. If it hasn’t hit its key level yet, there’s a strong chance the breakout is just an illusion. Stay patient, watch for confluence, and trade smarter.
How do you use correlation in your trading? 🚀 Join our Discord community to learn more.