E.G. Divergence
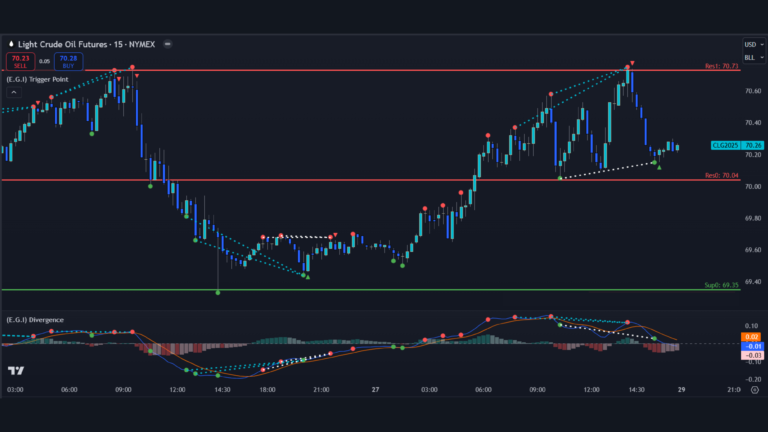
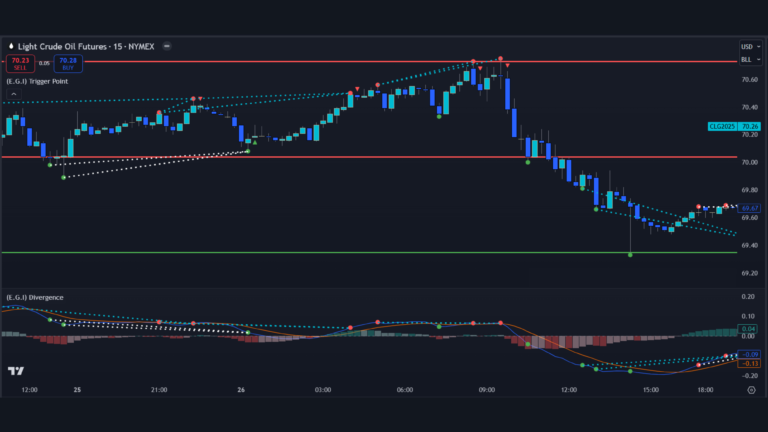
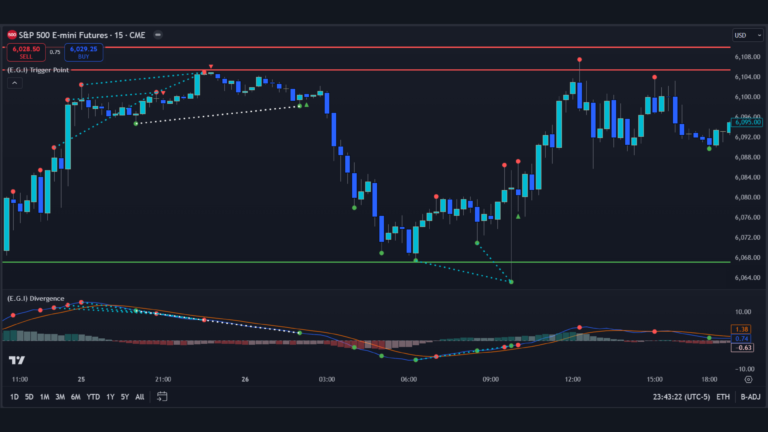
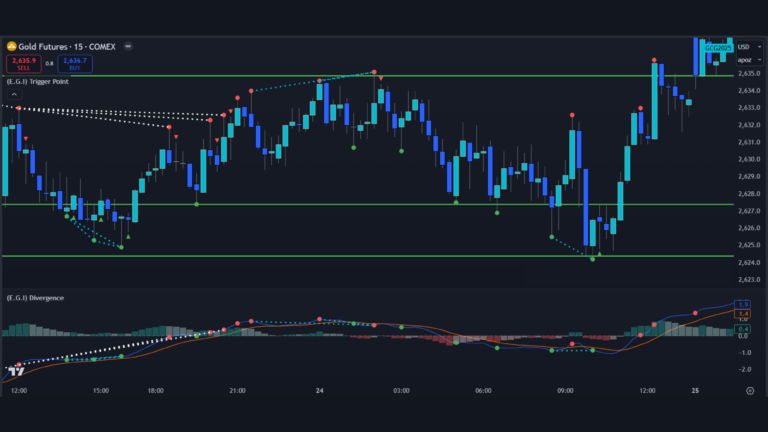
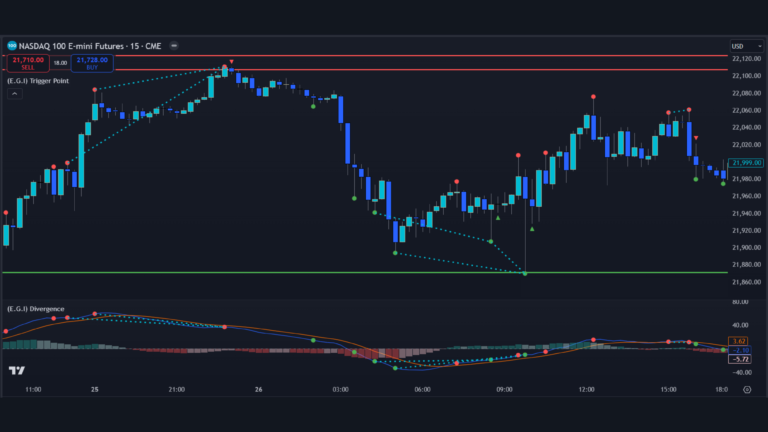
The E.G. Divergence is an indicator implemented for NinjaTrader 8 and TradingView platforms. Divergence in technical analysis may signal a major positive or negative price move; divergence occurs when the price of an asset moves in the opposite direction of a technical indicator, such as an oscillator, or contrary to other data.
Divergence is when the price and indicator are telling the trader different things. Confirmation is when the indicator and price, or multiple indicators, tell the trader the same thing. Ideally, traders want confirmation to enter trades while in trades. If the price is moving up, they want their indicators to signal that the price move is likely to continue; traders use divergence to assess the underlying momentum in an asset’s price and the likelihood of a price reversal.
For example, investors can plot oscillators on a price chart like the Relative Strength Index (RSI). If the stock is rising and making new highs, ideally, the RSI is also reaching new highs. If the stock is making new highs, but the RSI starts making lower highs, this warns the price uptrend may be weakening.
Our Automatic Strategy for NinjaTrader Users
To demonstrate the potential return of trading using the E.G. Divergence, we developed an automatic strategy for NinjaTrader, designed to take the divergence signals off our trigger points. The video below explains more about the E.G. Automatic Strategies developed for NinjaTrader:

