In trading, identifying whether a support or resistance level will hold or break is as much an art as it is a science. While technical levels derived from tools like Trigger Points and Fibonacci retracements provide valuable insights, the order book—specifically the Depth of Market (DOM)—offers a dynamic perspective that can confirm or challenge expectations. When paired with acceleration data, DOM analysis becomes a powerful tool for gauging whether a level is likely to hold or fail.
Building on the principles discussed in the “System of Expectancy”, this blog explores how DOM-based confluence and acceleration readings can refine decision-making, particularly when a level is tested with momentum.
Reminder: NQ Case study (12/30)
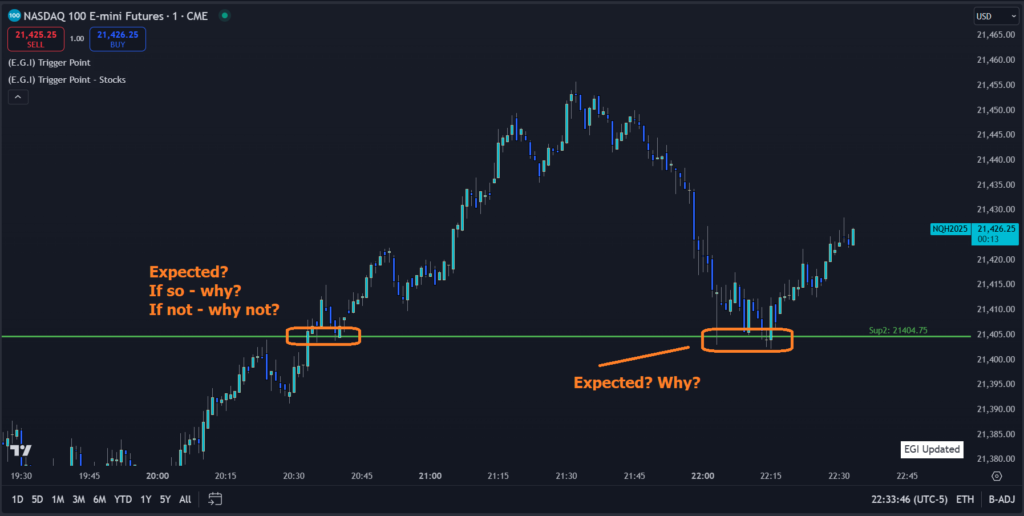
Below are the expected scenarios for NQ as observed. Let’s take a moment to observe the potential R:R and the success rate.
The figure below shows that a resistance level (previously respected) broke, retested (validated), and turned into a support level.
What is DOM-Based Confluence?
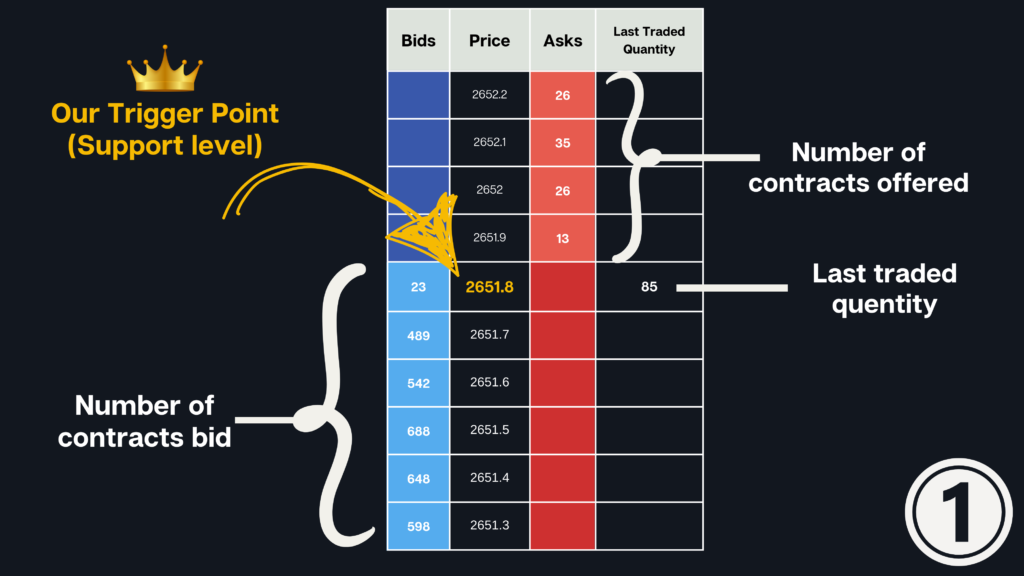
DOM-based confluence refers to aligning technical levels with the real-time data available in the DOM. The DOM shows the number of buy and sell orders at various price levels, providing insights into market participants’ intentions. When combined with acceleration data—measuring the speed of order flow or the rate at which orders are being placed, filled, or canceled—it reveals whether traders are defending or abandoning a level.
- Confluence Defined: The simultaneous occurrence of a price reaching a key technical level (e.g., support/resistance) and order flow confirming either strength (buyers/sellers defending the level) or weakness (momentum building to break the level).
- Acceleration’s Role: Acceleration identifies shifts in sentiment. If buyers aggressively add orders as a support level is tested, it suggests the level is likely to hold. Conversely, if sellers increase the pace of activity, it indicates mounting pressure to break the level.
How DOM-Based Confluence Helps Validate Expectations
As discussed in the “System of Expectancy,” traders enter with a hypothesis about the market’s behavior at a key level. DOM-based confluence acts as the real-time validator, helping to confirm or refute that hypothesis:
Detecting Strength at a Level:
- A support level respected earlier in the session might face a retest. Acceleration in buy orders at the DOM, combined with a visible increase in bid-side volume, indicates that buyers are defending the level.
- This aligns with the expectation that the level will hold, reinforcing a trade setup for a bounce.
Spotting Weakness:
- Suppose the market revisits the same support level, but this time, sellers dominate the DOM. Rapid acceleration in sell-side orders, coupled with a thinning of bids, signals a likely breach.
- In this scenario, traders can prepare for a breakout trade or avoid premature entries based on the assumption the level will hold.
Momentum Confirmation:
- After the level breaks, acceleration metrics provide context for the move. A sharp rise in sell-side activity indicates a high-momentum breakdown, often leading to significant follow-through. Conversely, deceleration after the break might suggest a potential reversal or retest opportunity.
Real-Time DOM Case Study (12/30): NQ Respecting and Breaking support
Let’s apply these principles to the NQ (Nasdaq-100 futures):
Respecting Support: In the morning session, NQ tested a support level identified by an E.G. Trigger Point. Buyers showed strength on the DOM, with accelerating bid-side orders and visible absorption of sell orders. This aligned with the expectation that the level would hold, presenting a high-probability bounce trade.
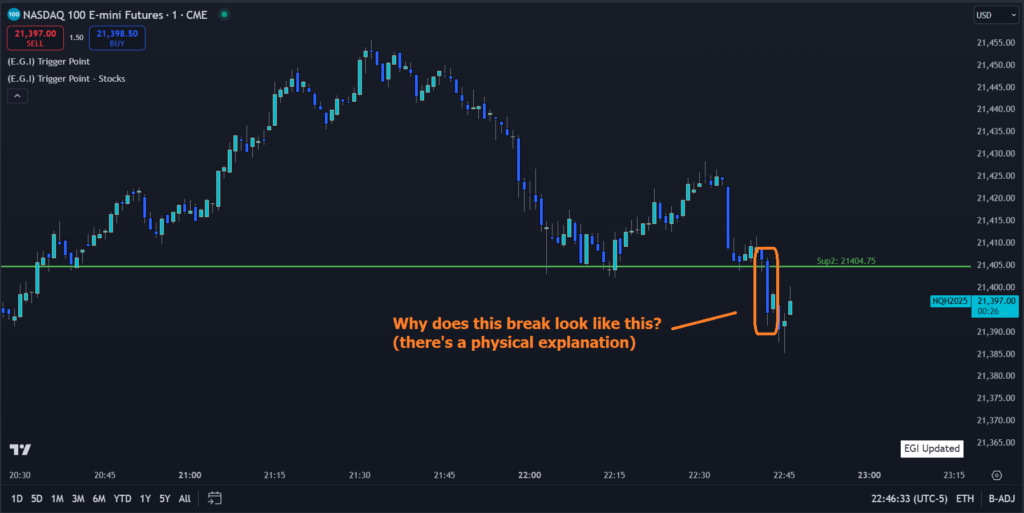
Breaking Support: In the afternoon session, the same level was revisited. This time, sellers aggressively added orders on the DOM, and acceleration showed a sharp increase in sell-side activity. Buyers were overwhelmed, leading to a decisive breakdown. The DOM’s confirmation of seller strength provided traders with the confluence to anticipate and capitalize on the momentum.
After the support level was respected, the following break was observed:
How to Use DOM and Acceleration for Confluence
Set Up the DOM:
- Use a trading platform like NinjaTrader to view the DOM alongside price charts.
- Focus on bid and ask volume at key levels to track buying and selling activity.
Monitor Acceleration Indicators:
- Tools like the E.G. AI Accelerometer measure the pace of order flow. Use this data to validate whether activity is intensifying or subsiding as the price approaches a level.
- Tools like the E.G. AI Accelerometer measure the pace of order flow. Use this data to validate whether activity is intensifying or subsiding as the price approaches a level.
Establish Key Levels:
- Combine static levels (e.g., Trigger Points or Fibonacci retracements) with dynamic indicators like the DOM. This provides a multi-layered view of market behavior.
- Combine static levels (e.g., Trigger Points or Fibonacci retracements) with dynamic indicators like the DOM. This provides a multi-layered view of market behavior.
Look for Divergences:
- A level showing strong technical support but weak acceleration on the buy side may indicate vulnerability.
- Conversely, a level with rising bid activity and slowing sell pressure suggests strength.
Combine with Expectancy Framework:
- Use the System of Expectancy to define primary and secondary hypotheses for each level. DOM-based confluence refines these hypotheses in real time, improving trade timing and execution.
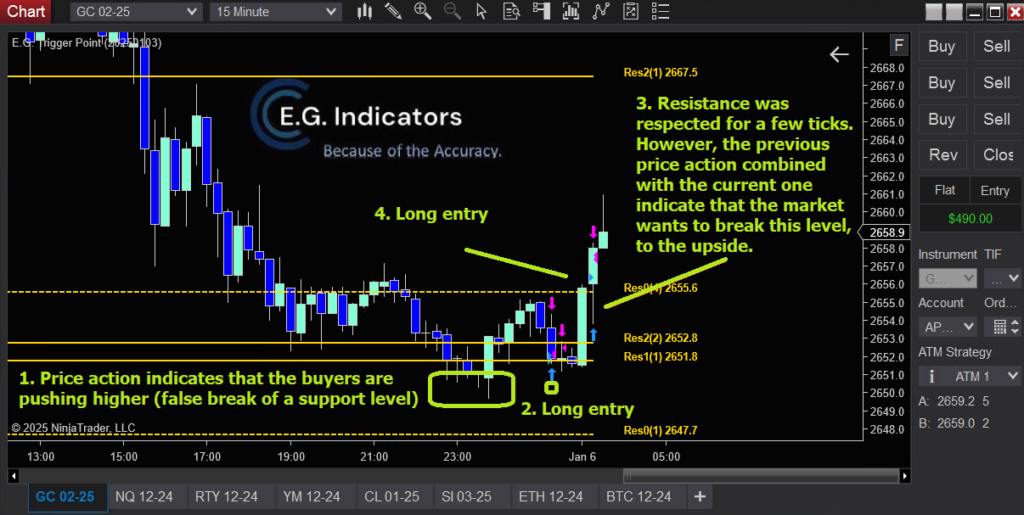
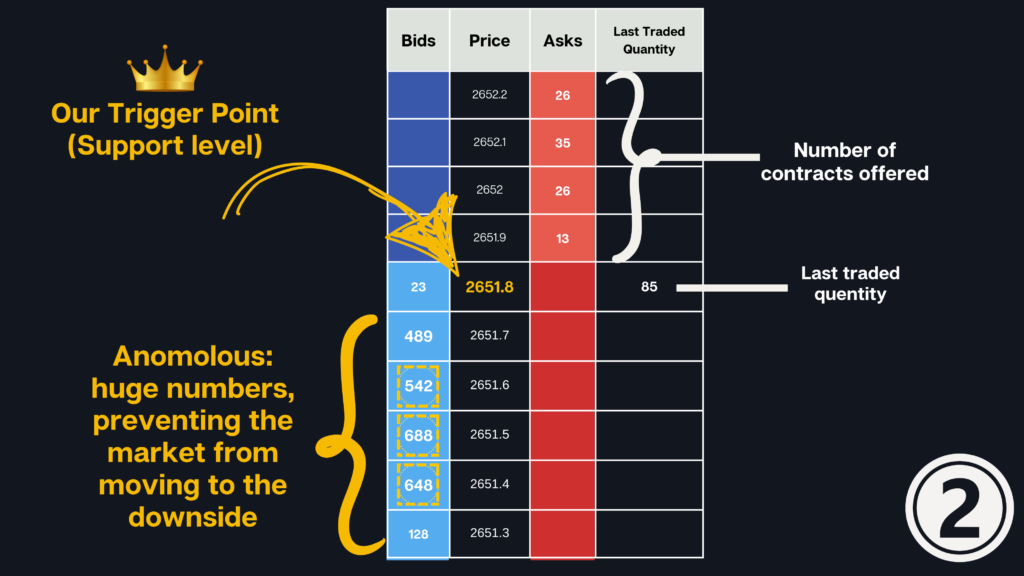
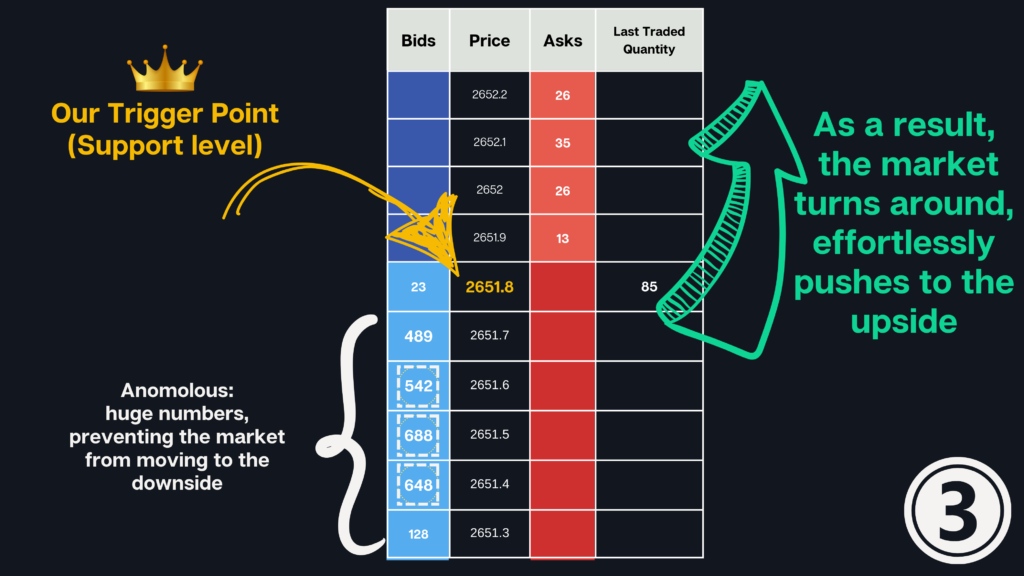
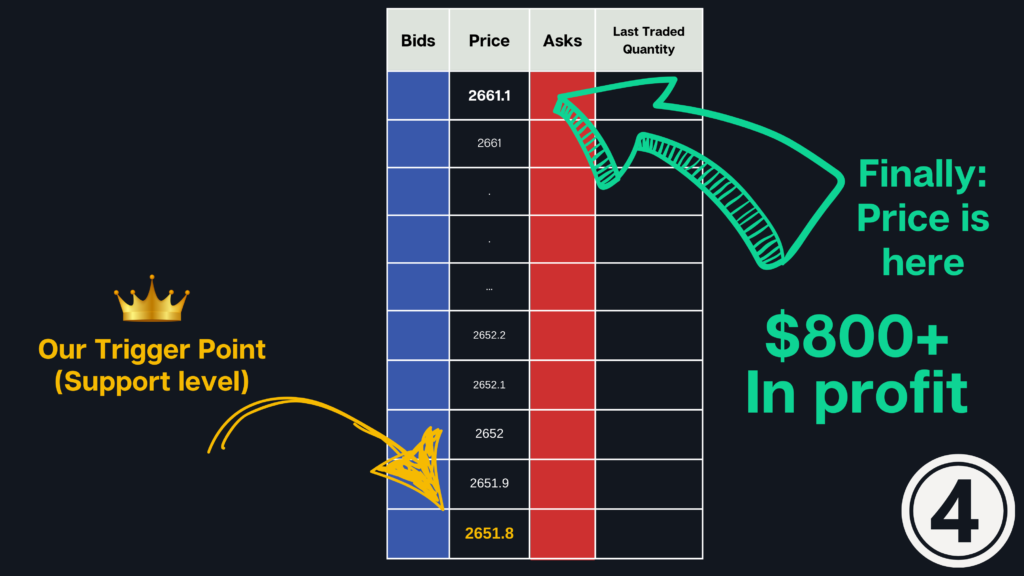
Real-Time DOM Case Study #1 (1/6): GC (Gold futures)
Below are quick scalps on GC (golden line), and a demonstration of the DOM:
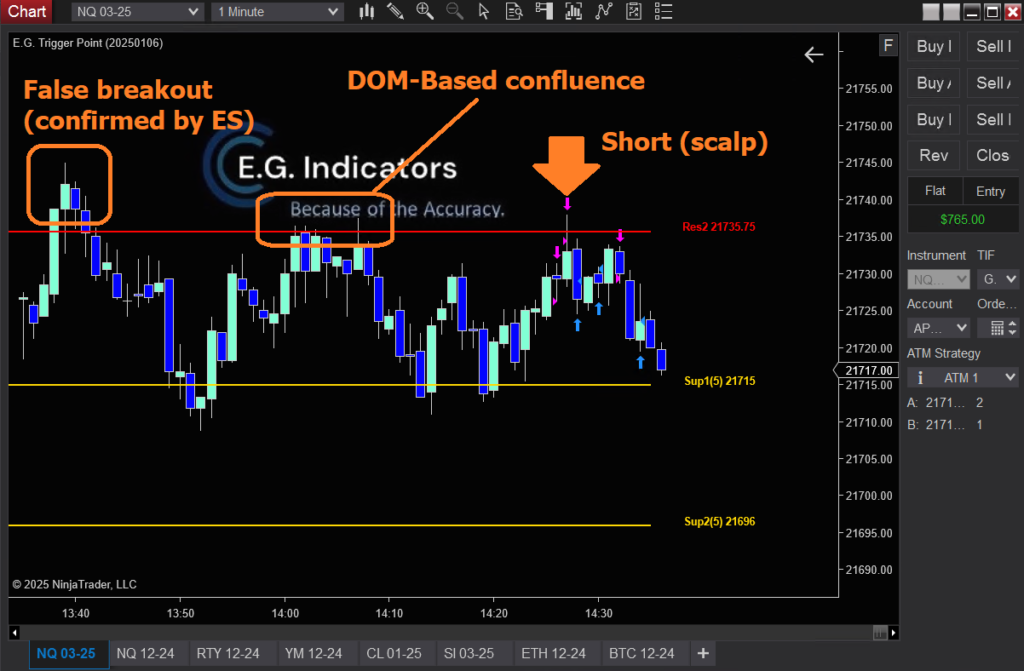
Real-Time DOM Case Study #2 (1/6): NQ (Nasdaq 100 futures)
Below are quick scalps on NQ:
Advantages of DOM-Based Confluence
- Clarity: Provides real-time validation of technical levels.
- Adaptability: Helps traders adjust to changing market dynamics, such as a shift from balance to imbalance.
- Precision: Reduces guesswork by offering concrete data on market participants’ behavior.
Final Thoughts: Mastering Confluence
DOM-based confluence, especially when paired with acceleration metrics, gives traders a competitive edge in understanding market dynamics. It bridges the gap between static technical analysis and dynamic market behavior, ensuring that trades are grounded in real-time evidence rather than speculation.
By integrating DOM analysis into your trading strategy and aligning it with tools like the E.G. AI Accelerometer, you can refine your ability to detect whether a level will hold or fail. This creates a more confident, informed approach to navigating the complexities of the market—turning the abstract into actionable insights.
Happy trading!


