
The E.G. Trigger Point
Support & Resistance 2.0-
AI-based key levels (support & resistance)
-
The levels are fixed and non-repaint
-
Delivered daily 10 hours before the market opens
-
Timeframe-agnostic, proprietary algorithm
-
Instruments: futures, stocks and ETFs
-
Platforms: NinjaTrader and TradingView
-
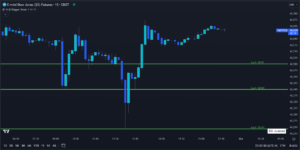
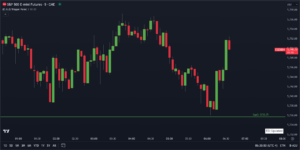
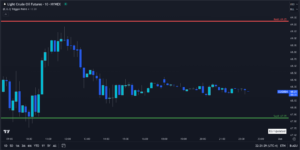
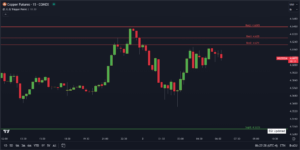
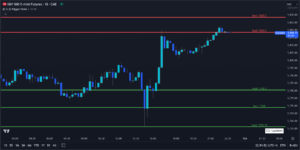
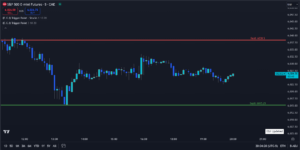
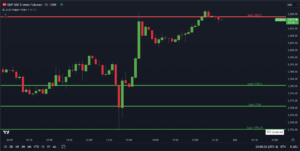
The E.G. Trigger Point, a precision-driven indicator, is seamlessly integrated with NinjaTrader 8 and TradingView. Powered by an AI engine on our cloud server, it delivers significant price levels (support and resistance) daily, 10 hours before the market opens. Our AI’s prowess in identifying these key levels is honed by analyzing market data that is not readily available on most trading platforms. This precision-driven approach, a fusion of technical analysis and machine-learning techniques, enables the algorithm to pinpoint areas of interest with single-tick accuracy.
The algorithm aims to identify those key levels by analyzing past market participants’ collective behavior reflected in historical, correlated, and deep market data. The claim of “single-tick accuracy” implies that the algorithm can statistically pinpoint key lines rather than zones. This could be particularly useful for traders relying on precise entry and exit points to minimize risks and maximize the risk-reward ratio.
In particular, our levels are specific price points on a chart expected to attract the maximum amount of buying or selling (i.e., significant price levels in contrast to random ones). Our support price is a price at which one can expect more buyers than sellers. Likewise, our resistance price is a price at which one can expect more sellers than buyers. This can provide valuable insights into potential price movements and help you make more informed trading decisions.
Specifically:
The resistance level, indicated by a horizontal line, is higher than the current market price. It is a price point on the chart where traders expect maximum supply (in terms of selling) for the asset. The resistance level is always above the current market price. The likelihood of the price rising to the resistance level, consolidating, absorbing all the supply, and declining is high → The resistance often acts as a trigger to sell.
The support level is lower than the current market price; it is a price point on the chart where the trader expects maximum demand (in terms of buying) for the asset. Whenever the price falls to the support line, it is likely to bounce back. There is a maximum likelihood that the price will fall until the support consolidates, absorbs all the demand, and then starts moving upwards → The support often acts as a trigger to buy.
The E.G. Trigger Point algorithm could benefit various trading strategies. Here are a few potential applications:
- Scalping
- Reversal trading
- Breakout and trend trading
- Stop-loss optimization
Supported Instruments

- AI-based support and resistance levels
- The levels are fixed (non-repaint)
- Delivered daily 10 hours before the market opens (not lagging)
- Calculated from historical and correlated market data
- Platforms: NinjaTrader and TrdingView