

This powerful tool lets you see what most traders can’t: the battle between buyers and sellers at every price level. Whether you’re looking for hidden support/resistance, liquidity traps, or volume-based breakouts, this heatmap-style indicator gives you a tactical edge.
- Buy/Sell Imbalances
- Congestion Areas
- Volume Footprints
- Market Sentiment
- Liquidity Traps
- Volume-Based Breakouts
- Lifetime Access
- Free Updates
- NinjaTrader 8
The E.G. Foorprint Supertrend is a pair of indicators implemented for the NinjaTrader 8 platform. Both can help you identify buying and selling pressure and gauge the market’s sentiment. A footprint is a visualization technique that shows trading activity at each price level over a particular timeframe.
It’s a way to dissect the order flow, making it easier to identify areas of support and resistance, as well as potential trading opportunities. To do so, it displays the following:
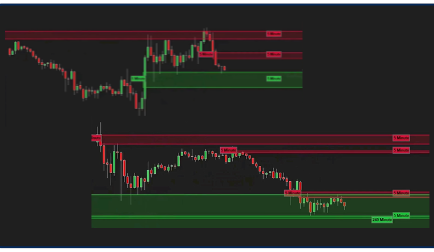
- Heatmap – where the color intensity and size of the “footprint” at each price level represent the buying or selling activity amount. The more intense the color, the more activity occurred at that price. This can help you identify imbalances in buying and selling pressure, areas of congestion where prices tend to bounce or break out, potential support and resistance levels, and market sentiment and order flow dynamics.
- Volume Profile – a graphical representation of trading activity at various price levels, but with a focus on the volume traded at each level. It’s often displayed as a vertical histogram, where each bar’s height corresponds to the total volume traded at that price level; it can be used in conjunction with other technical indicators to form a more comprehensive view of the market. By analyzing it, you can gain insights into market participant behavior, which can inform their trading decisions.
Together, they can help you identify:
(1) Areas of high volume, indicating significant trading activity
(2) Imbalances in trading activity, which can indicate potential reversals or breakouts
(3) The value area, where the majority of trading activity occurs
(4) Potential stop-loss and take-profit levels